Power BI To Transformation Data Into Insightful Graphics Through
It is critical to have a thorough understanding of your digital product, including both its strong and weak features. Nonetheless, it is critical to identify the major areas that need to be improved in order to grow the Power Bi platform and make it more user-friendly.
With data, you can draw a range of inferences, such as users leaving the website from a specific page or drop-offs from the application in a short period of time, as well as high return rates. However, determining these criteria is not always indicative of a problem because visitors may leave a website because they have completed their work.
In this case, figuring out the factors is not always suggestive of a problem. In order to draw a reasonable conclusion from the information that has been accumulated, it is necessary to examine it thoroughly.
What is Data Visualization?
Data visualization is the process of transforming raw data into visual representations, such as charts, graphs, and maps, to facilitate understanding and communication. It aims to present data in a visual format that is easily interpretable and allows users to identify patterns, trends, and relationships. By leveraging visual elements, such as colors, shapes, and sizes, data visualization provides a powerful tool for exploring and analyzing data. It helps to uncover insights, communicate findings, and support decision-making.
Effective data visualization goes beyond simply creating visually appealing charts. It involves thoughtful selection of the appropriate visual representations based on the data and the intended message. Design principles, such as clarity, simplicity, and accuracy, are crucial to ensure that the visualization effectively conveys the desired information. Additionally, interactivity and storytelling techniques can be employed to enhance engagement and enable users to interact with the data, explore different perspectives, and draw their own conclusions.
Data visualization has become increasingly important in today’s data-driven world. It plays a vital role in various domains, including business, science, journalism, and public policy. By transforming complex data into visual representations, it enables users to quickly grasp information, spot trends, and communicate insights to a broad audience. Whether it’s exploring sales trends, analyzing scientific data, or presenting public health information, data visualization serves as a powerful tool for making data more accessible, understandable, and actionable.
Read: 9 Key Microsoft Power BI Features For Businesses
What is Power BI?
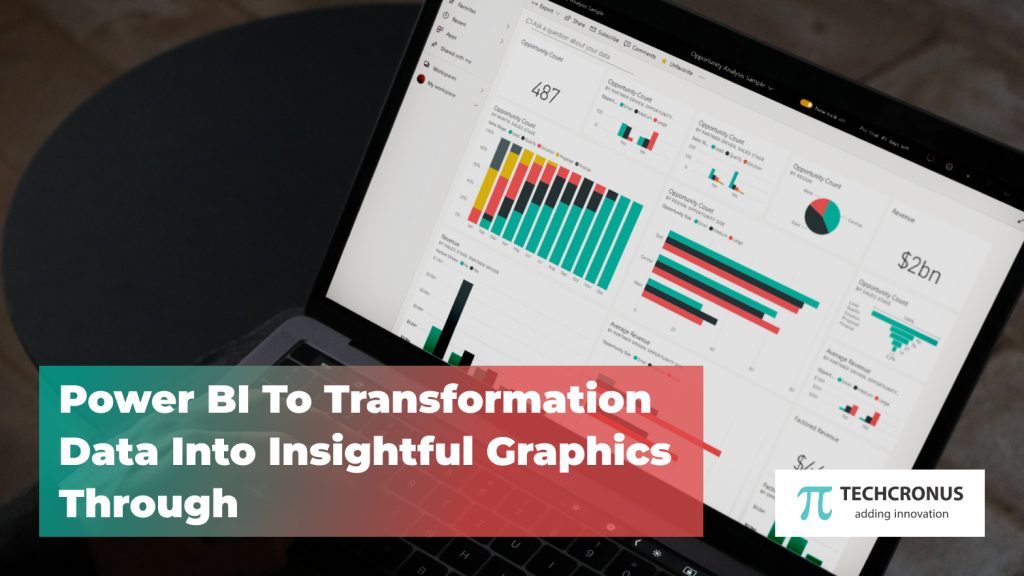
Power BI is a business analytics and data visualization platform developed by Microsoft. It enables users to gather data from various sources, transform it into meaningful insights, and present it through interactive visualizations and reports. Power BI offers a suite of tools and features that cater to different aspects of the data analysis process, from data preparation and modeling to visualization and collaboration.
At its core, Power BI allows users to connect to multiple data sources, including databases, spreadsheets, online services, and cloud platforms. It provides robust data transformation capabilities, allowing users to clean, shape, and combine data from different sources to create a unified and reliable dataset. With a drag-and-drop interface and a wide range of visualization options, Power BI enables users to build compelling and interactive visualizations, such as charts, graphs, maps, and dashboards. These visualizations can be customized, filtered, and linked to create a cohesive and interactive data exploration experience.
Power BI also offers collaboration and sharing features that facilitate teamwork and knowledge sharing. Users can publish their reports and dashboards to the Power BI service, making them accessible to others within their organization or even externally. Additionally, Power BI integrates with other Microsoft tools and services, such as Excel and SharePoint, providing a seamless experience for data analysis and reporting. With its user-friendly interface, powerful data analysis capabilities, and robust sharing options, Power BI has gained popularity as a versatile tool for data visualization and business intelligence across industries.
Benefits of Power BI Development:
- Data-driven decision-making: Power BI enables users to visualize and analyze data from multiple sources, helping organizations make data-driven decisions. By presenting data in clear and interactive visualizations, Power BI makes it easier to identify patterns, trends, and insights that may not be apparent in raw data alone.
- Improved data accessibility: With Power BI, users can connect to various data sources, including databases, cloud services, and online platforms. This accessibility allows organizations to gather and integrate data from different sources, providing a comprehensive view of their operations and performance.
- Interactive visualizations and reports: Power BI provides a wide range of visualization options, allowing users to create interactive and engaging reports and dashboards. The drag-and-drop interface makes it easy to build visualizations, customize them, and create interactive elements such as filters and drill-throughs, enabling users to explore data and gain deeper insights.
- Collaboration and sharing: Power BI allows users to publish their reports and dashboards to the Power BI service, making them accessible to others within the organization. This promotes collaboration and knowledge sharing, as users can share insights, collaborate on data analysis, and make informed decisions together.
- Integration with other tools and services: Power BI seamlessly integrates with other Microsoft tools and services, such as Excel, SharePoint, and Azure. This integration provides a unified and streamlined experience for data analysis, reporting, and data management.
- Cost-effective solution: Power BI offers different pricing options, including a free version with limited features and paid plans with more advanced capabilities. This flexibility makes Power BI an affordable option for organizations of all sizes, allowing them to leverage data visualization and analytics without significant upfront costs.
Power BI development empowers organizations and individuals to leverage their data effectively, make informed decisions, and drive business growth through enhanced data visualization and analysis capabilities.
A Power BI Development Company can assist you in the preparation of your data, the determination of your business Metrics, the creation of bespoke representations, and the construction of customizable reports and dashboards, regardless of the type of business you run.
